Get Profiler/Do Profiling
Profiler is one component of PyMimircache, which can be used for profiling and plotting, including getting reuse distance and hit ratio curve plotting.
Profiling with LRU
First, let’s try LRU (least recently used), here is how to get a LRUprofiler:
>>> profiler_LRU = c.profiler('LRU')
- To get reuse distance for each request, simply call the functions below. The returned result is a numpy array:
>>> reuse_dist = profiler_LRU.get_reuse_distance()
array([-1, -1, -1, ..., -1, -1, -1], dtype=int64)
- To get hit count, hit ratio or miss ratio, we can do the following:
>>> profiler_LRU.get_hit_count()
array([0,  2685,  662, ...,   0,   0,  48974], dtype=int64)
Hit count is a numpy array. The nth element of the array means that among all requests, that many requests will be able to fit in the cache if we increase cache size from n-1 to n. The last two elements of the array are different from all others, the second to the last element indicates the number of requests that needs larger cache size (if you didn’t specify the cache_size parameter, then it is 0). The last element says the number of cold misses, meaning the number of unique requests.
>>> profiler_LRU.get_hit_ratio()
array([ 0,  0.02357911,  0.02939265, ...,  0.56992061,   0,  0.43007939])
Hit ratio is a numpy array. The nth element of the array means the hit ratio we can achieve given cache size of n. Similar to hit count, the last two elements give the ratio of requests that needs larger cache size and the ratio of requests that are unique.
>>> profiler_LRU.get_miss_ratio()
array([ 1,  0.97642089,  0.97060735, ...,  0.43007939,   0,  0.43007939])
Miss ratio is a numpy array. The nth element of the array means the miss ratio we will have given cache size of n. The last two elements of the array are the same as that of the hit ratio array.
Note
for reuse distance, hit count, hit ratio, miss ratio, if you don’t specify a cache_size parameter or specify cache_size=-1, it will use the largest possible size automatically.
- With the data calculated from profiler, you can do plotting yourself, or any other calculation. But for your convenience, we have also provided several plotting functions for you to use. For plotting hit ratio curve (HRC):
>>> profiler_LRU.plotHRC()
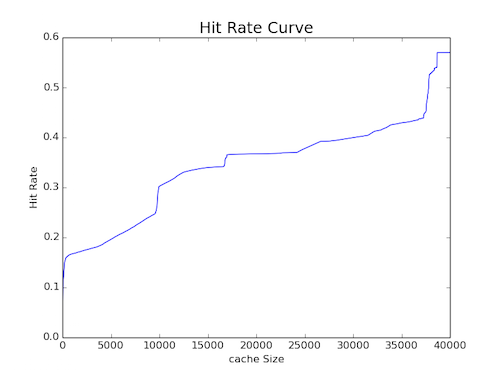
Hit ratio curve(HRC) of the trace
- Similarly, we can plot miss ratio curve (MRC):
>>> profiler_LRU.plotMRC()

Miss ratio curve(MRC) of the trace
Warning
Upon testing, using keyword arguments might cause error in some of 32-bit platform, if you get an error, please try not using keyword arguments.
Profiling with non-LRU
Apart from LRU, we have also provided a variety of other cache replacement algorithms for you to play with, including Optimal, FIFO, LRU-2, LRU-K, MRU, LFU, LFU_Fast, Random, SLRU, S4LRU, clock, LinuxClock, TEAR, LightLRU adaptive SLRU.
Note
Check here for detailed information about each cache replacement algorithms.
To play with these cache replacement algorithms, you just substitue ‘FIFO’ in the examples below with the cache replacement algorithm you want, then give a cache_size and bin_size (how fine you want the profiling; the smaller, the slower). The reason why we need cache_size and bin_size is that for a general cache replacement algorithm, the profiling is done by sampling at certain points among all cache size, in other words, the nth element in numpy arrays returned represents the result at cache size of n*bin_size. Some examples are shown below:
- Obtaining a profiler:
>>> profiler_FIFO = c.profiler('FIFO', cache_size=2000, bin_size=100)
Several other parameters and their default values are listed below, use_general_profiler is only used when cache replacement algorithm is LRU. The reason why we want to use a general profiler for LRU is that profiling for LRU using a LRU profiler has time complexity of O(NlogN), while general profiler with sampling has time complexity of O(N). They will have a large time difference on big data.
| Keyword Argument | Default Value | Required |
|---|---|---|
| cache_size | No default value | YES |
| bin_size | cache_size//100 | No |
| cache_params | None | Depend on algorithm |
| num_of_threads | num of cores in the machine | No |
| use_general_profiler | False | No |
- After obtaining the profiler, everything else is the same as above with LRUProfiler, you can obtain hit_count, hit_ratio, miss_ratio, you can plotHRC,
The only difference is that the returned hit_count array, hit_ratio array, miss_ratio array do not have the last two special elements as above.
Some examples are shown below: >>> profiler_FIFO.get_hit_count() >>> profiler_FIFO.get_hit_ratio() >>> profiler_FIFO.get_miss_ratio() >>> profiler_FIFO.plotHRC()
Note
Reuse distance related operation is only allowed on LRU, so don’t call get_reuse_distance on non-LRU cache replacement algorithms.
Note
If you want to test your own cache replacement algorithms, check here.